RPI—15-16 July 2019—R. M. Hazen
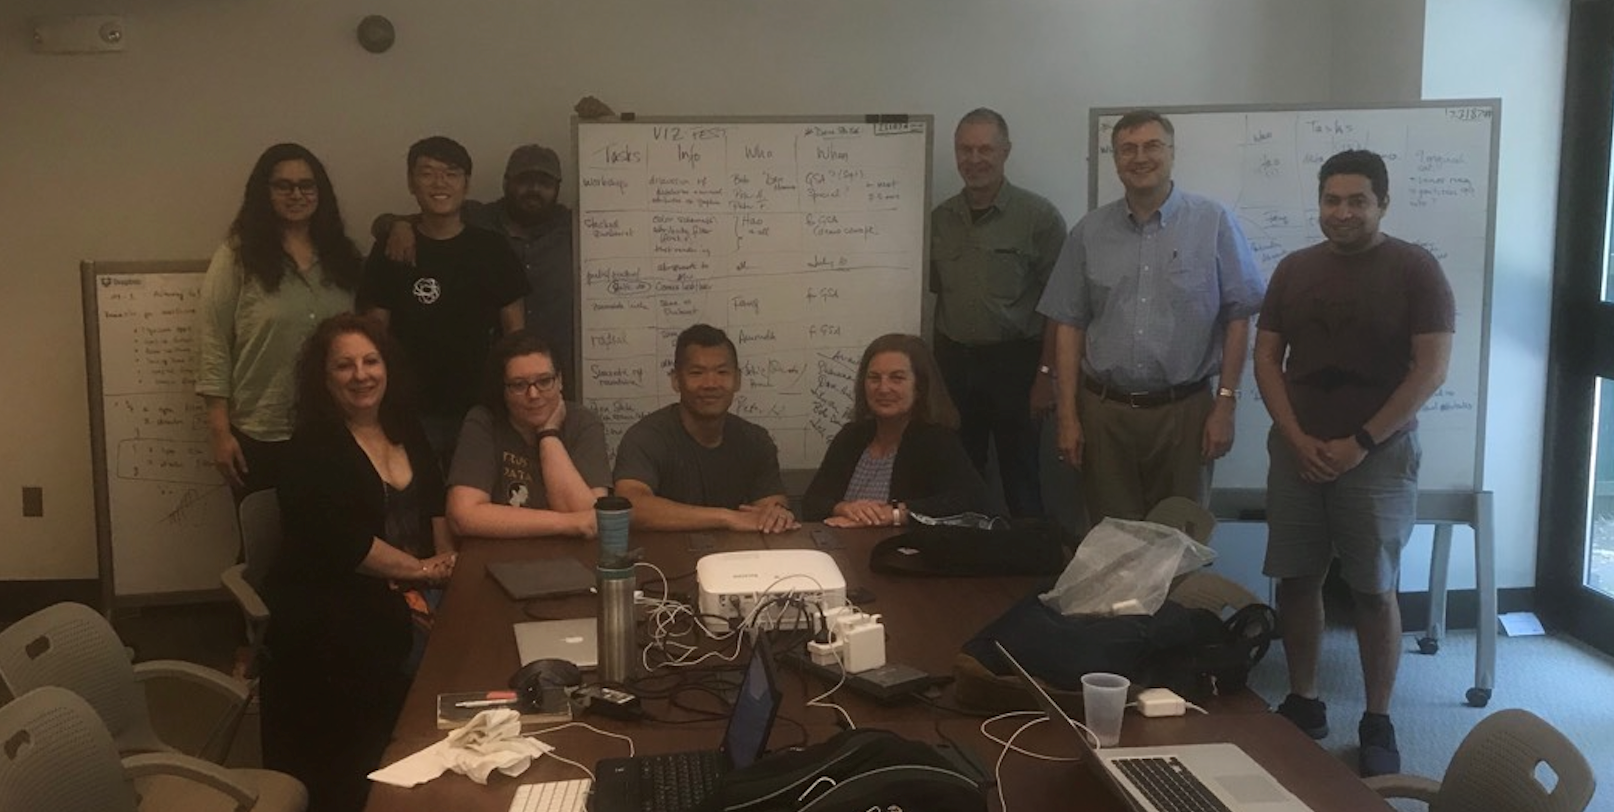
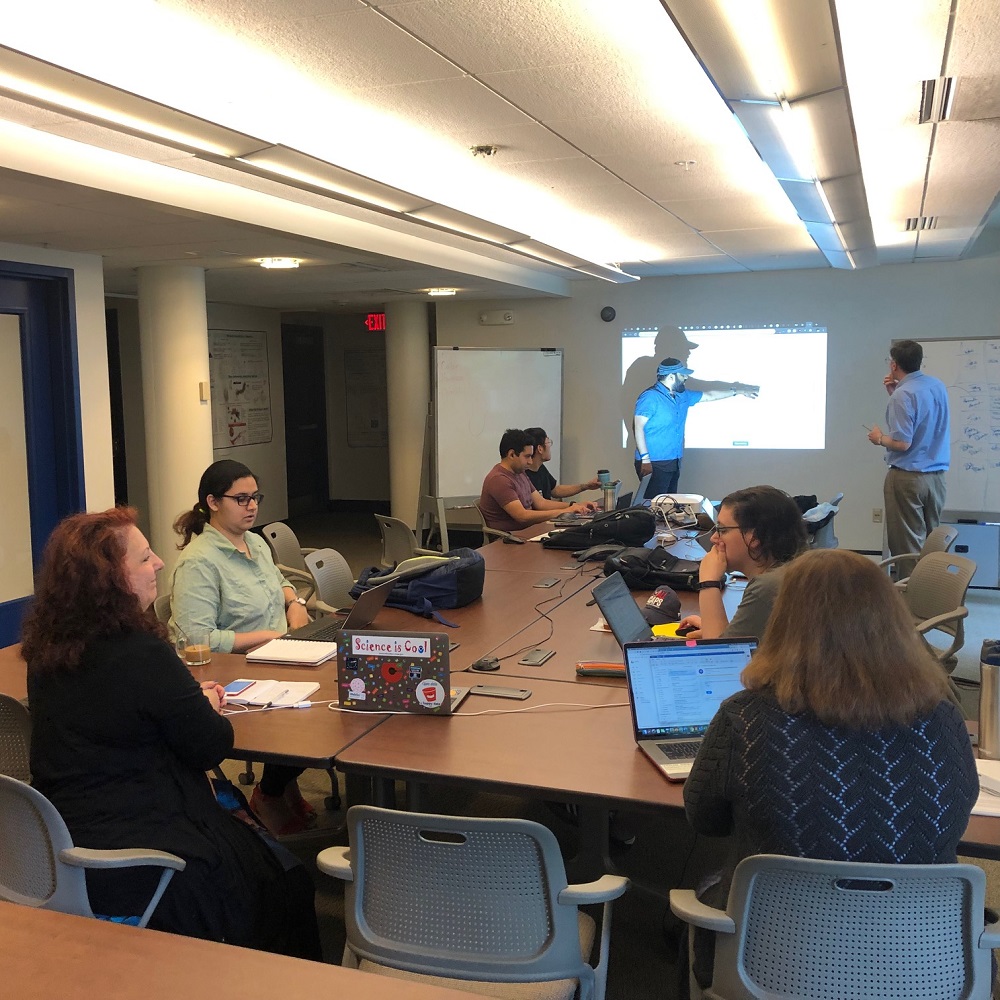
Sitting L-R: Kathy Fontaine, Katherine Chastain, Hao Zhong, Brenda Thompson
Missing: Peter Fox, Dan Hummer (via videolink)
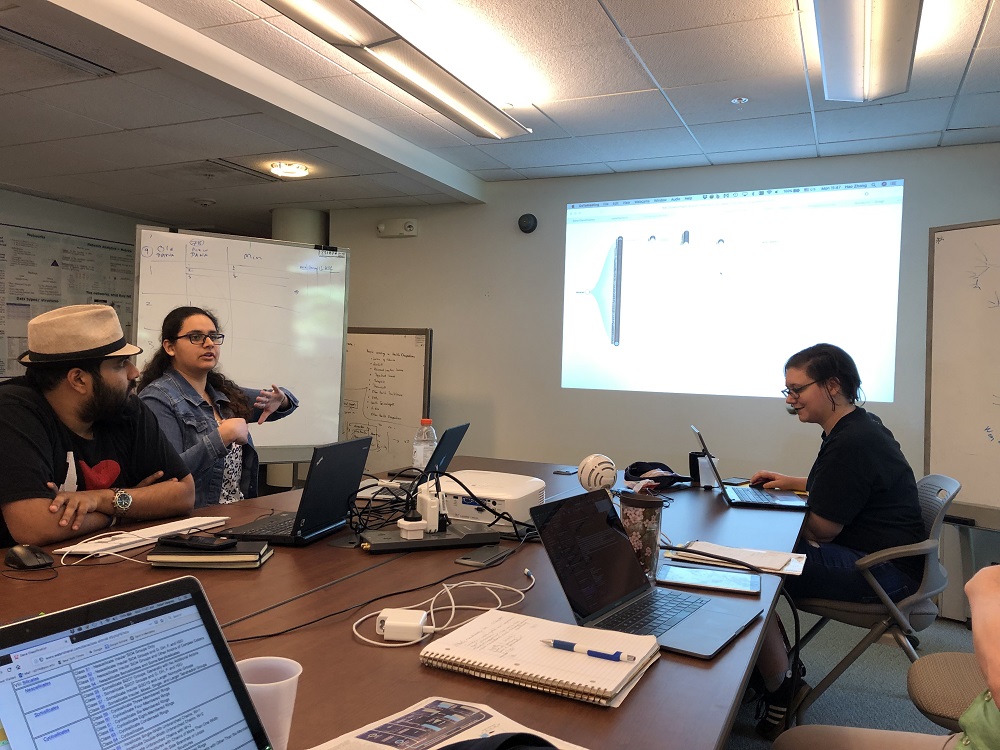
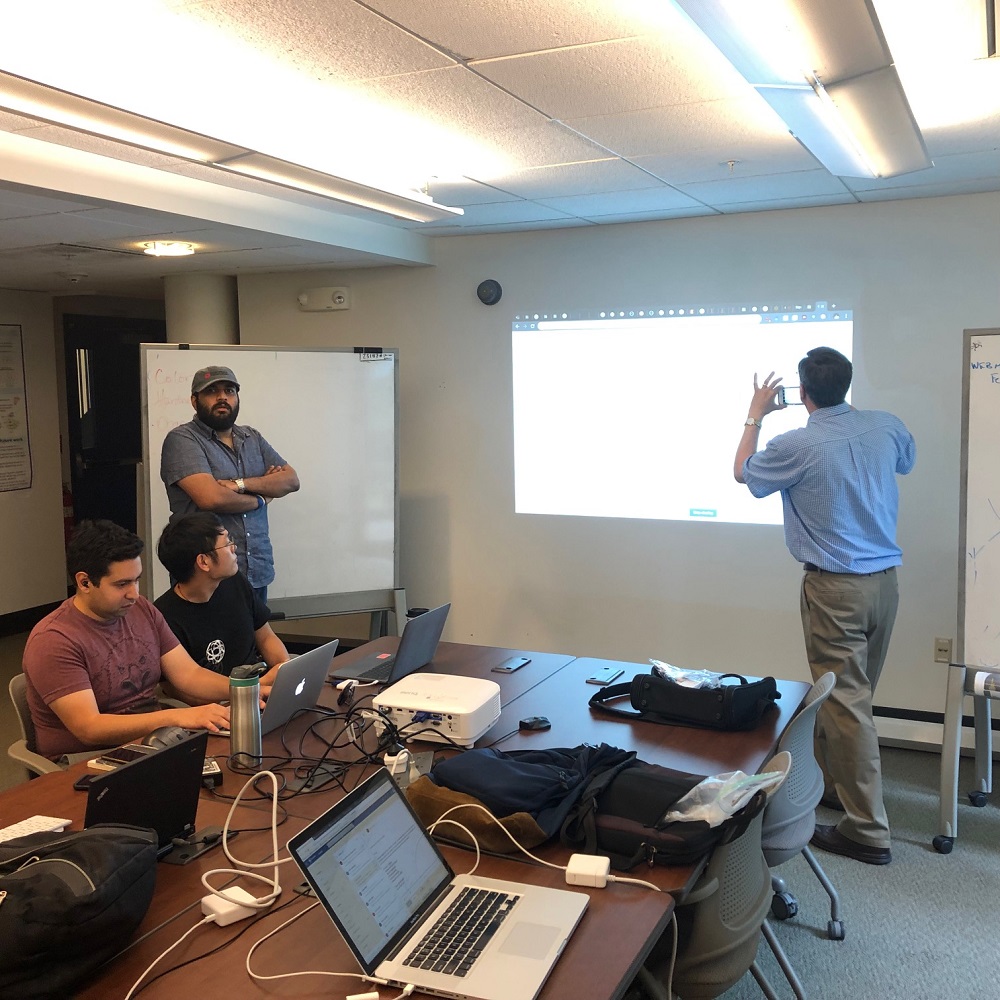
We had a terrific 2-day meeting at RPI with Peter Heaney of Penn State, Dan Hummer of Southern Illinois University (via videolink), Bob Hazen of Carnegie, and Peter Fox’s data science team. Peter Fox and I met Sunday evening July 14 and the entire group convened on Monday morning at Winslow. Peter Heaney’s ambitious objective was to “visualize all of mineralogy”—here meaning the 5400+ IMA-approved mineral species and some of their attributes, as organized in the “Dana classification” of minerals. Our efforts focused on a variety of challenges and opportunities associated with mineral classification, mineral databases, and visualization methods.
The first challenge was that there isn’t just one “Dana System.” We had one version from the 8th published edition (1998) of the Dana System with 78 major subdivisions (an expansion of the “Old Dana’s” 9 categories) as outlined on the “webmineral” website. But we also had a more recent version with 99 subdivisions (from a source we could not at first identify). The problems were compounded by the fact that the two versions had different numbers of minerals and different lists of attributes. We concluded that we wanted to use the earlier grouping of 78 subdivisions with the full list of 5400+ IMA-approved species. This decision required some merging of data from several sources—a process not fully completed during the vizfest.
Thanks to preparation by the RPI team, we were able to enlist a variety of visualizations early on. We soon agreed that several hierarchical renderings held promise—starburst, radial, tree, etc., all of which convey similar information constrained by the Dana System. Each has 9 highest-level divisions (native elements; sulfides; oxides; etc.), with up to 5 additional subdivisions. The decisions to go with Dana 8th edition and 5400+ species defined the content and by the end of day 1 we had our first visualization of “all mineralogy” in a starburst diagram by Hao Zhong:
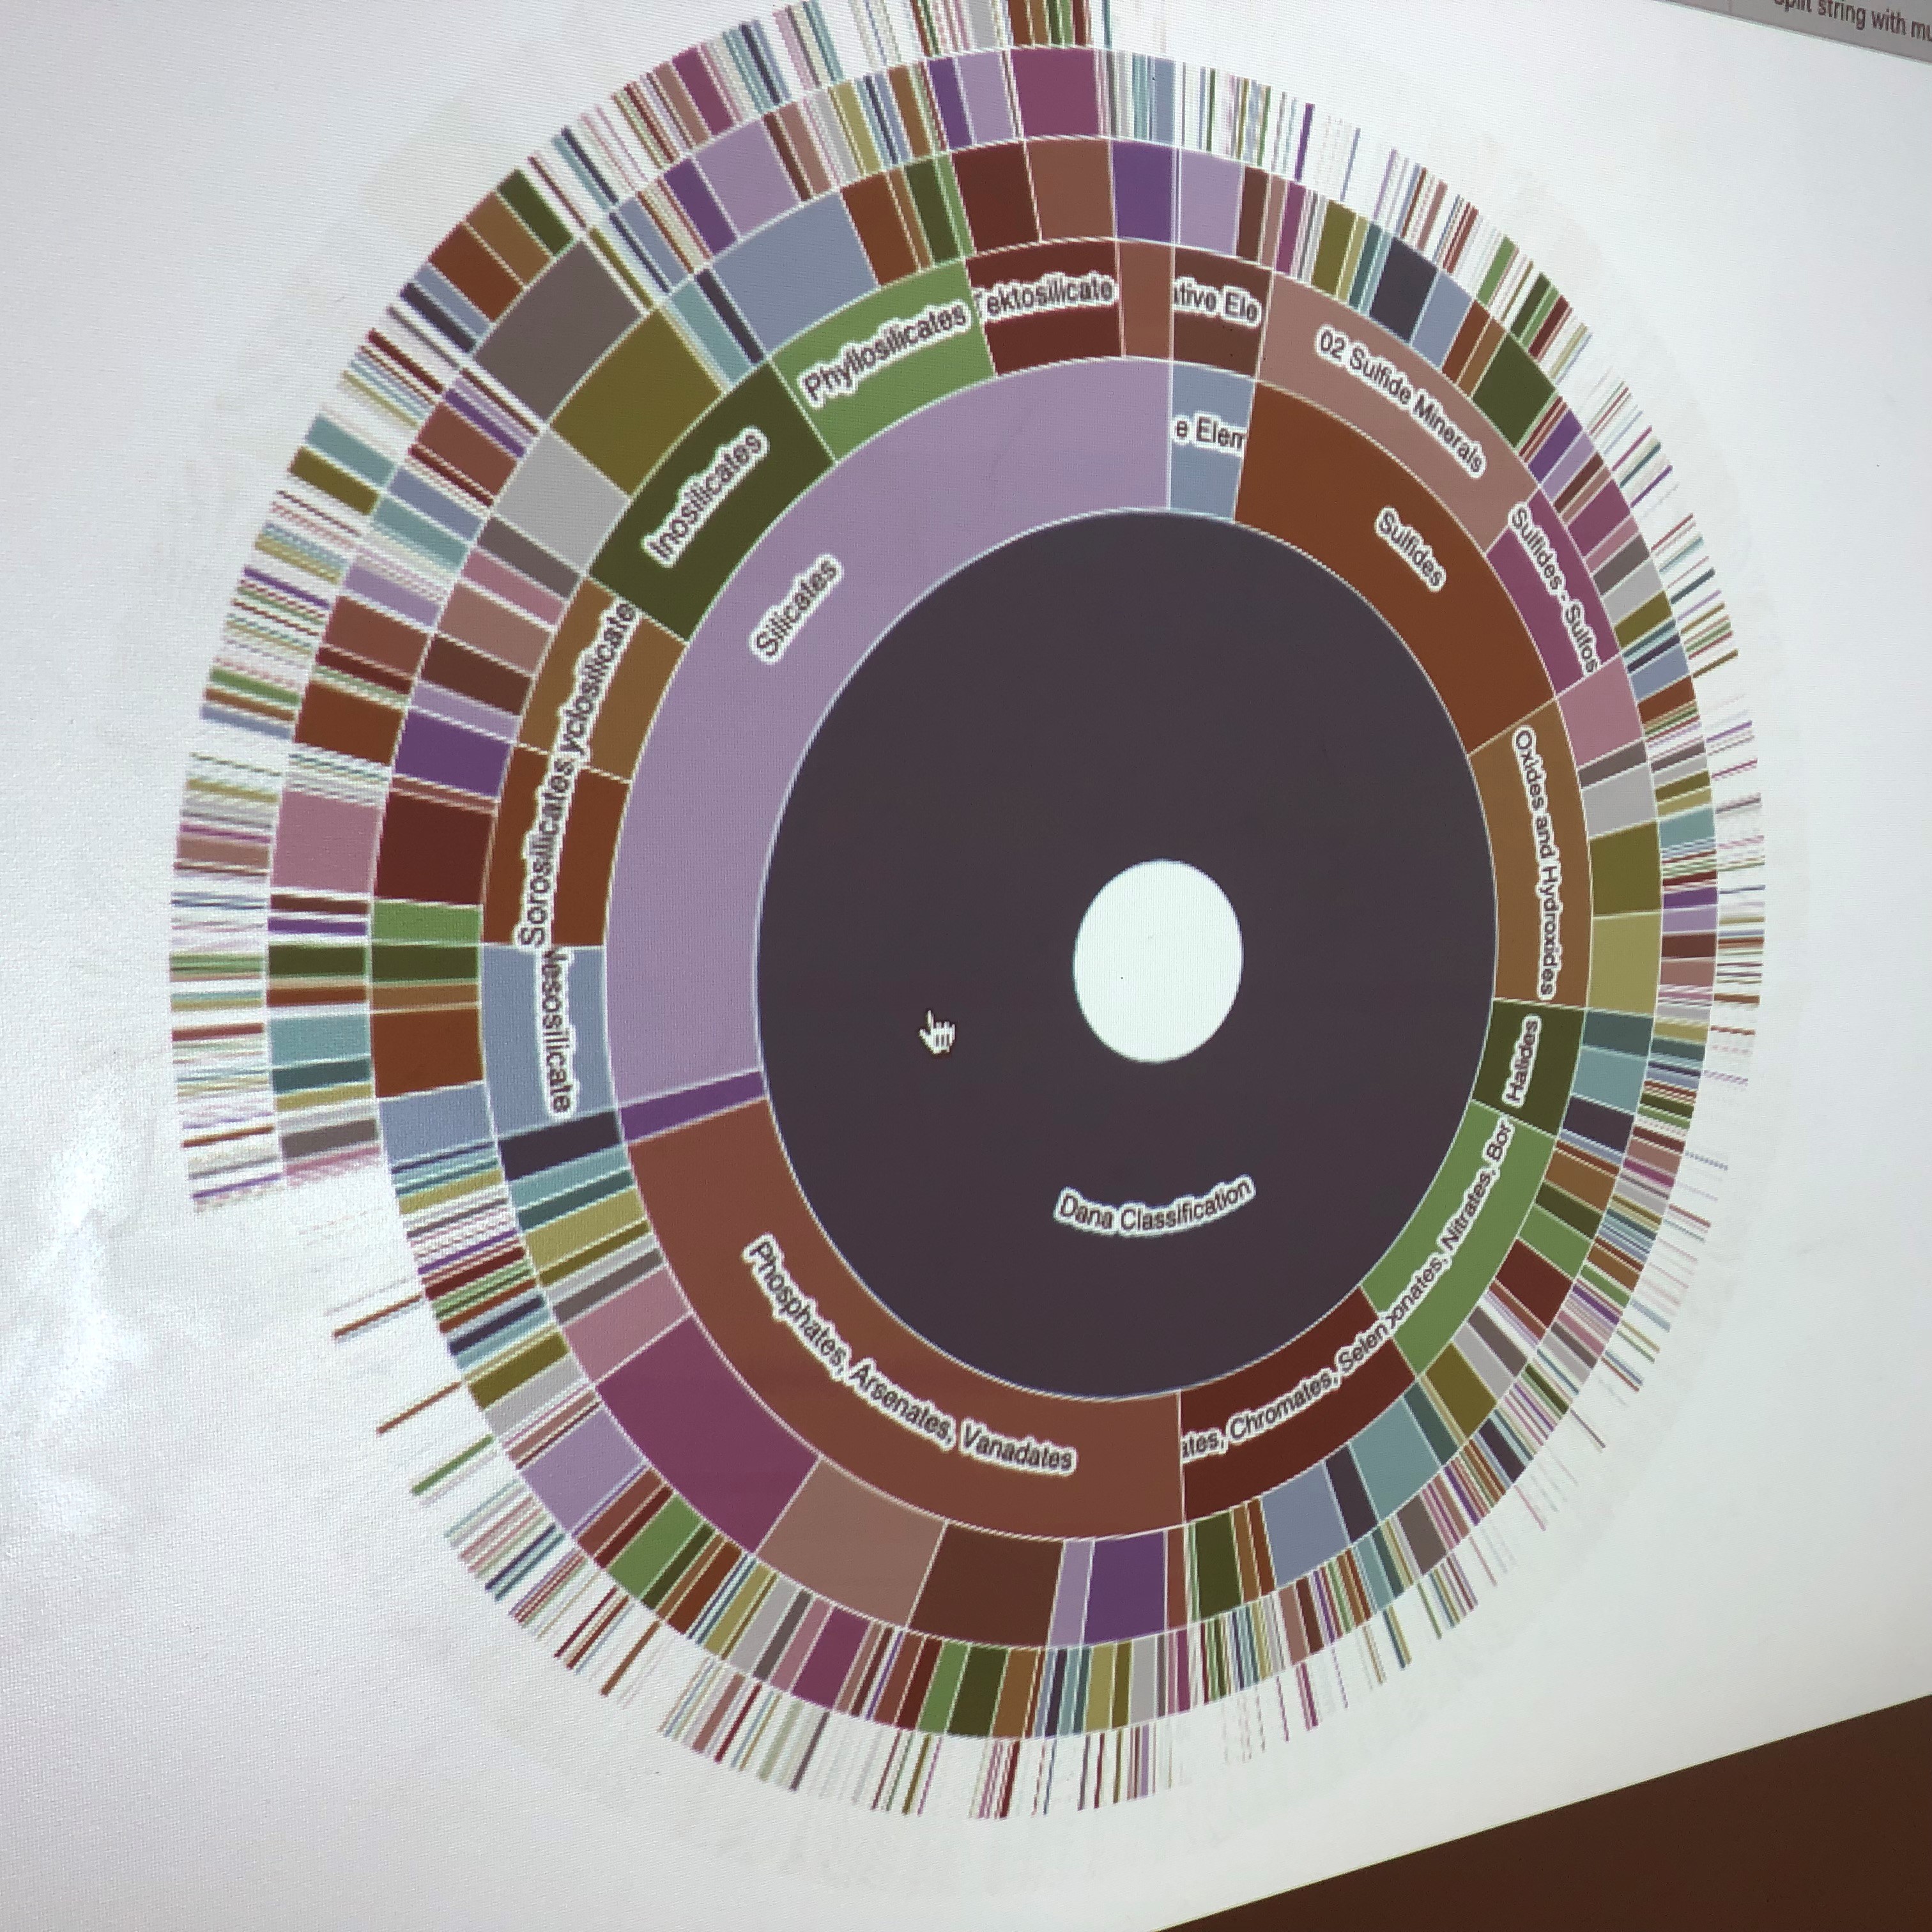
Part of the power of this interactive rendering is that one can click on any of the curved segments and see just that subset in a new starburst with fewer concentric rings. Note that the colors here convey no extra information, though that will come.
Over the next day the RPI team presented several equivalent renderings, including a “tree” diagram, most familiar to me in its use for the geological timescale:
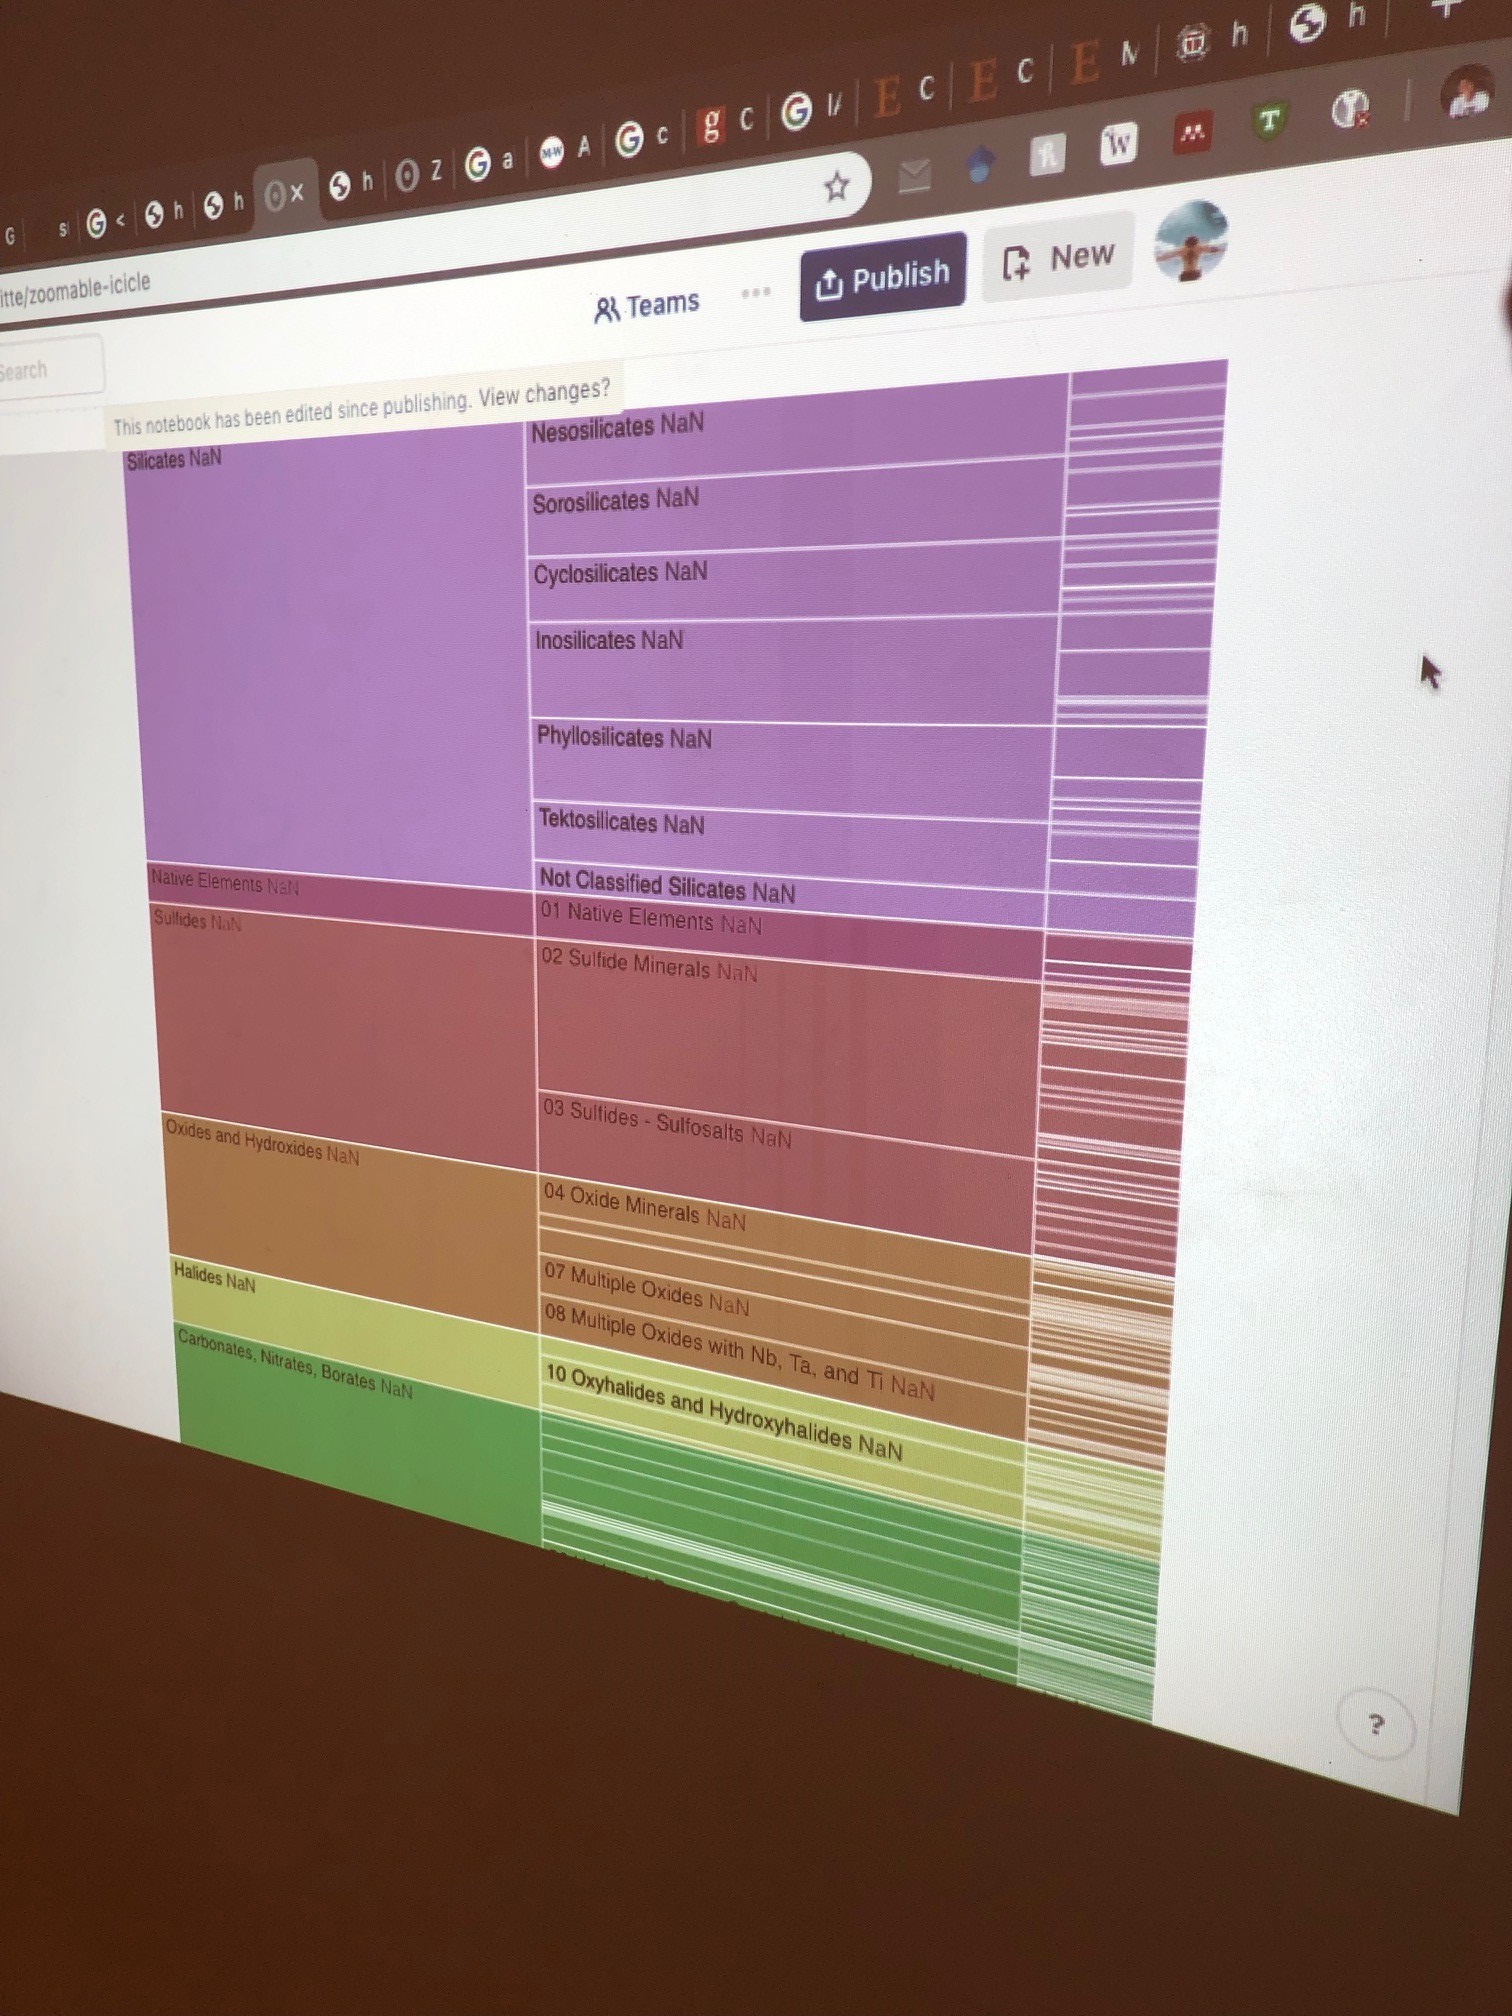
Note that this rendering contains the exact same information as the starburst. The format is less flashy, but the labels are easier to read.
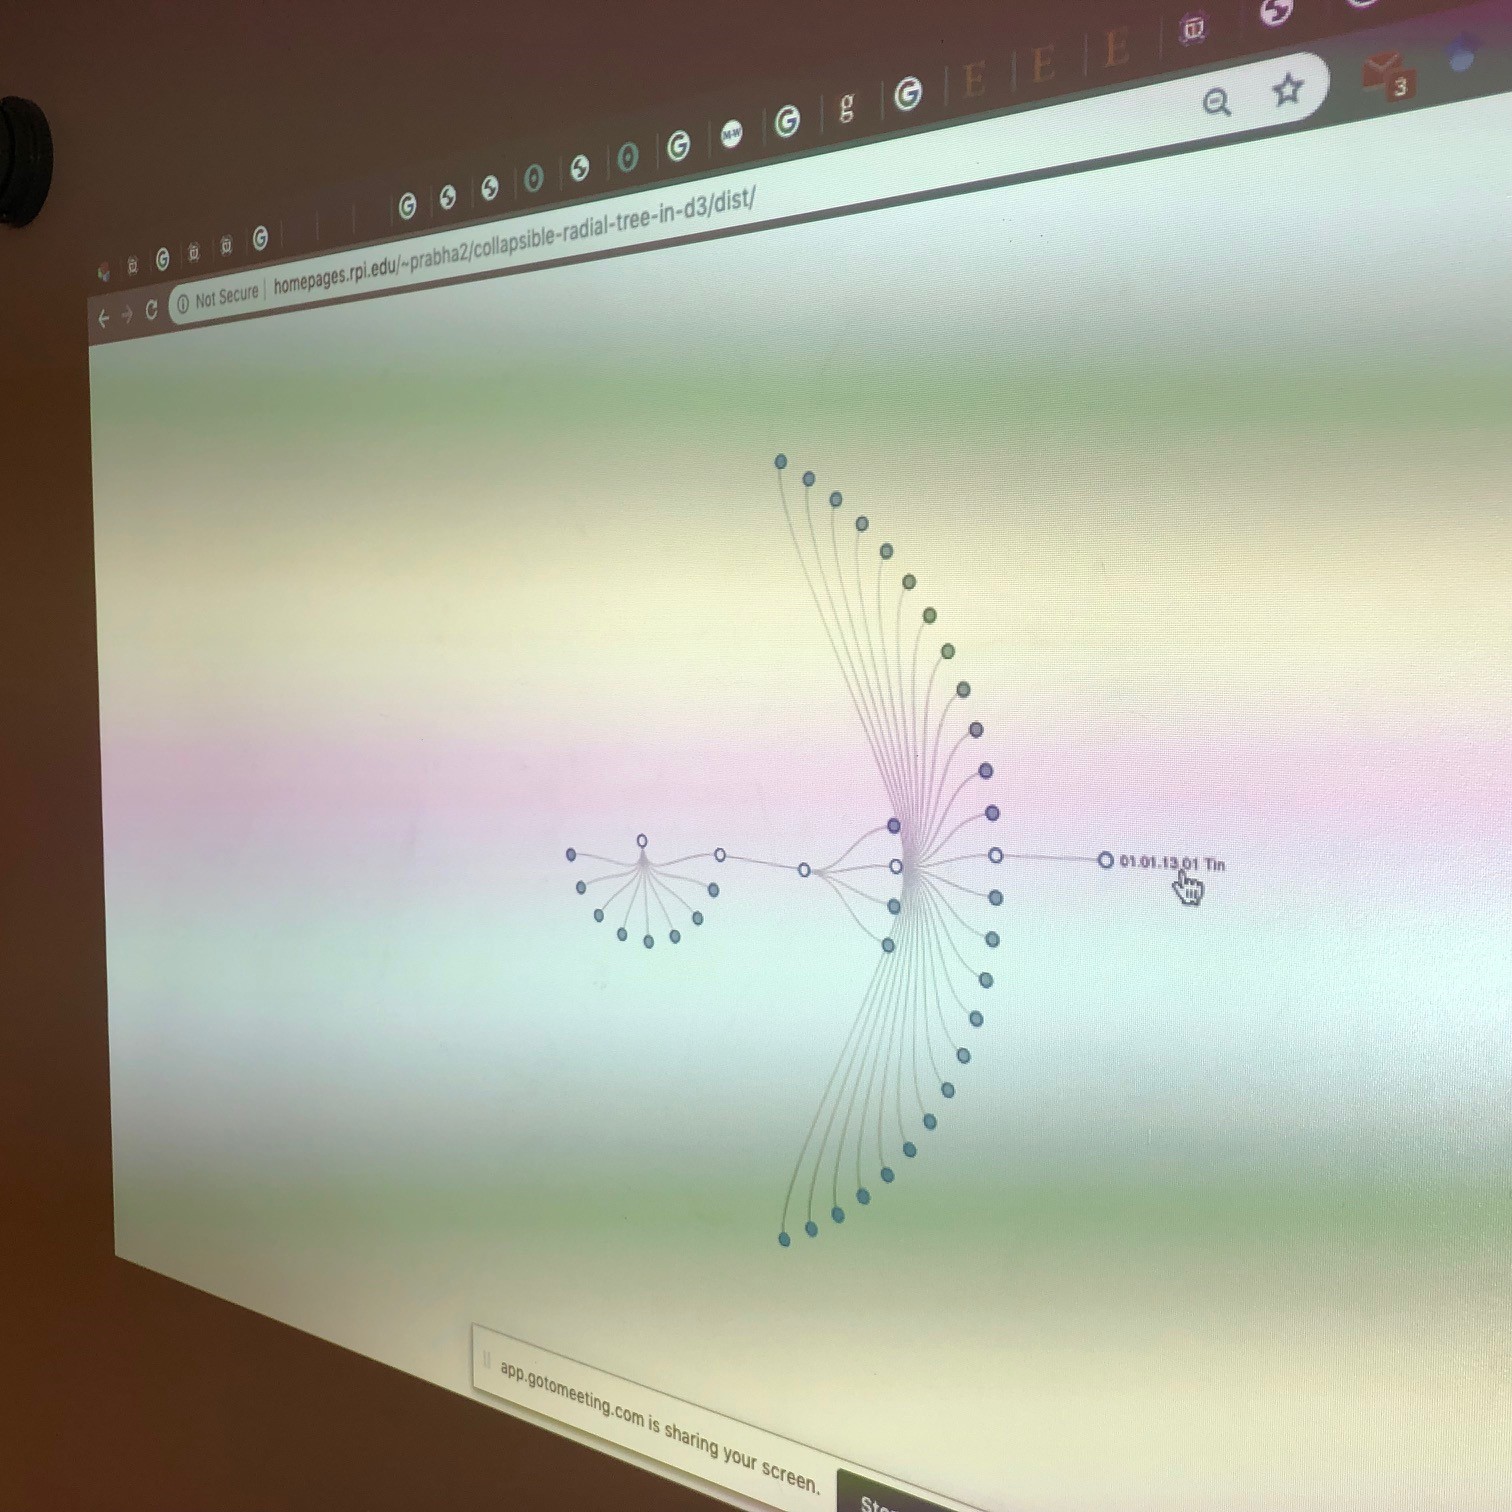
We also explored a radial design, with linear links among hierarchical nodes:
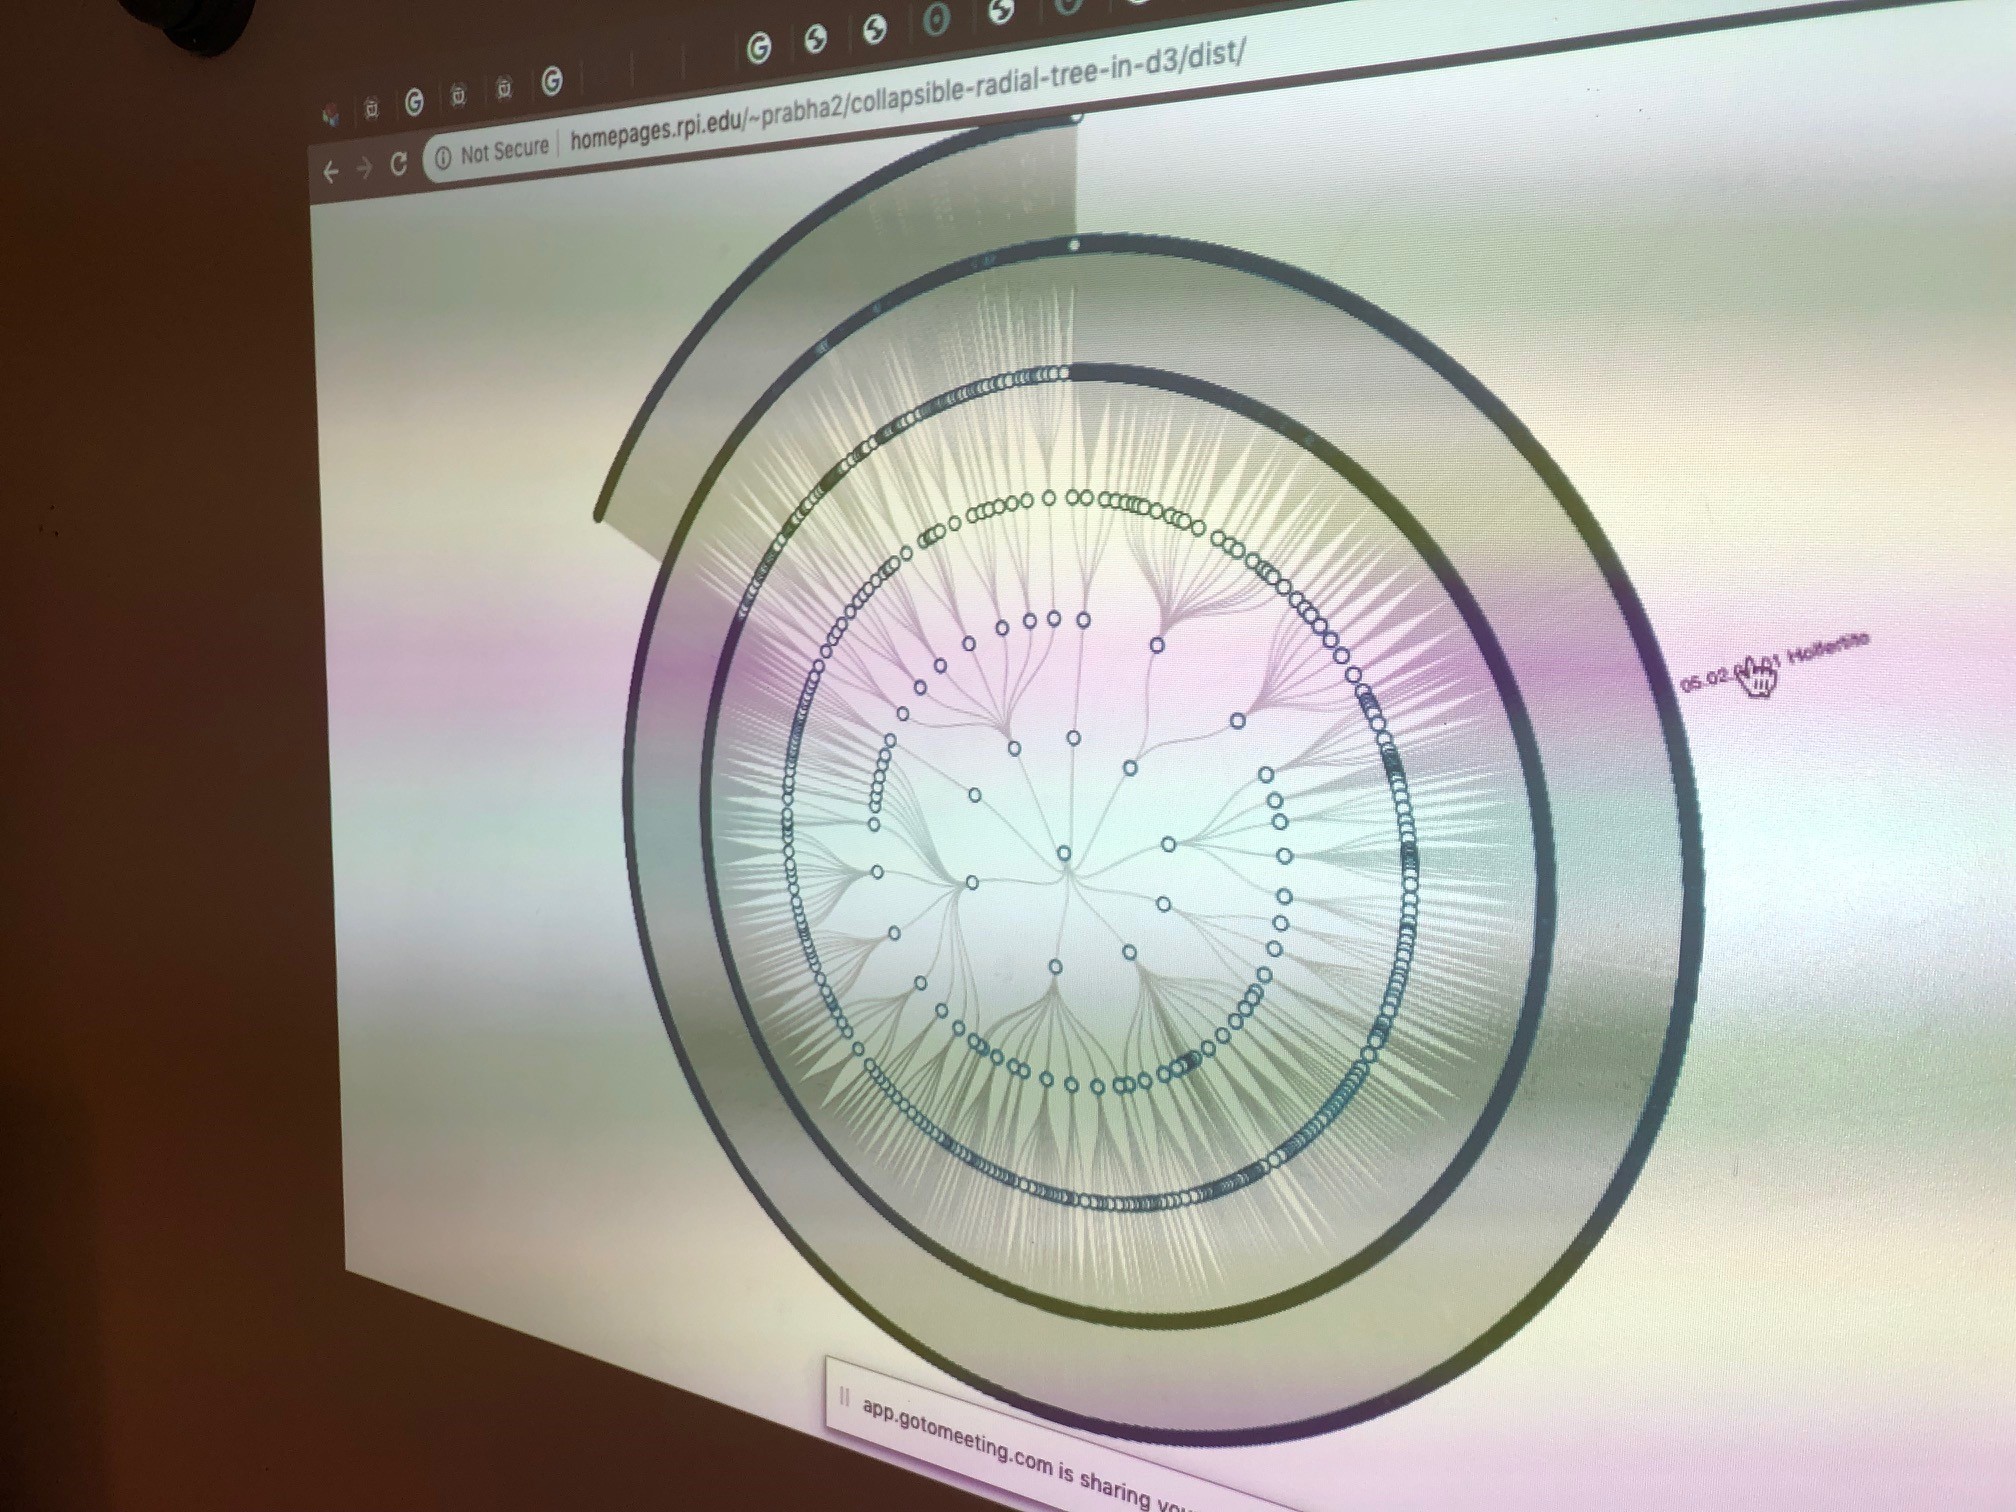
As in the other interactive diagrams, you can click on any individual node to see a subset of all connections:
So, we are delighted that there are now multiple opportunities to render “all mineralogy” in a single diagram. One promising option for an eventual open-access, interactive platform is to be able to toggle rapidly through these (and maybe other) convenient renderings.
The next challenge is to color the different segments/blocks according to mineral attributes. We began this important aspect of the project by discussing what are the key attributes of minerals and how can we obtain comprehensive, reliable data in a machine-readable format. Fortunately, some of this has already been done and more can be accomplished because every attribute is linked to one of the 5400+ IMA-approved mineral species. But here we run into a significant philosophical dilemma related to how we define a mineral “species” or “types.” There exists a tension between the IMA official definitions of minerals, which are idealized in terms of composition and structure, and natural samples with their idiosyncratic, non-ideal attributes.
Consider the example of wanting to highlight every one of the 5400+ minerals that can be blue in color. The ideal IMA species have certain intrinsic properties. Azurite is intrinsically blue, so that would be included in any list of blue minerals. But the case for diamond is different: ideally diamond is C in the diamond structure, with hardness 10, transparent and colorless, and it has other ideal properties, as well. But natural diamond occurs with all sorts of information-rich characteristics that affect color, hardness, physical properties, and more. If we are using the 5400+ idealized IMA species, then perhaps we should have a database that reflects only the properties of those idealized end-members—everything including end-member composition, idealized structure, thermochemical properties, physical attributes, etc. One could then colorize the starburst diagrams based on those ideal attributes of the IMA official species. Some subset of that list would be blue in their ideal end-member state.
But natural minerals are complex, messy, information-rich, with properties that can vary wildly depending on trace and minor elements, structural defects, and other non-ideal aspects. IMA diamond is colorless, but natural diamond can be blue or yellow or pink or brown. Hundreds of other minerals occur naturally in a variety of colors, with varied chemical and physical attributes not reflected in the ideal IMA species. So I would argue that we also need a database that reflects the range of attributes of natural specimens.
The result is that one could color the starburst according to what minerals are intrinsically blue, but also by the much larger set of minerals that sometimes occur as blue in nature. This dichotomy between ideal (minimum information definition) and natural (information-rich reality) can lead to complexities in the design of one or more databases. What should our comprehensive mineral database look like? What attributes do we incorporate? How do we acknowledge the ranges of values that occur in natural specimens?
I'm thinking that there could be two complementary databases. First is the complete IMA list with the idealized formula, structure, and properties of the pure version. That database could have 5400+ lines with dozens of attributes. The second data object is a list of as many natural samples as possible, with all the information possible on trace elements, isotopes, solid and fluid inclusions, structural defects, color, etc. That expanding resources could eventually have millions of lines with hundreds of attributes.
The distinction between these two databases reflects the contrast between the IMA classification system and the recently proposed “evolutionary system of mineralogy.” It would be best if these two systems remain complementary and, as much as possible, compatible. It is not immediately obvious how to do this, especially in a way that has sufficient global buy-in that it will be embraced by many mineral professionals and enthusiasts. One obvious aspect is that we need to build on mindat and rruff and not invent something new. But the formats/contents of those resources might need to be expanded in some significant ways, especially in the addition of new fields and their metadata.
One outcome of the vizfest is the recognition that we need to convene some kind of intensive workshop to think about content/format/funding/leadership—scientific and social and data science considerations of mineral databases all folded together. Again, much of this work has been pioneered by mindat and rruff, and it is possible that we already have the required infrastructure in place. It may be that we need to expand GEMI or use ODR or have multiple, interactive data resources, or whatever. It has been suggested that many of us will be at GSA in September, which might provide an ideal time to gather and brainstorm in a preliminary way.
Action Items:
We agreed on several next steps.
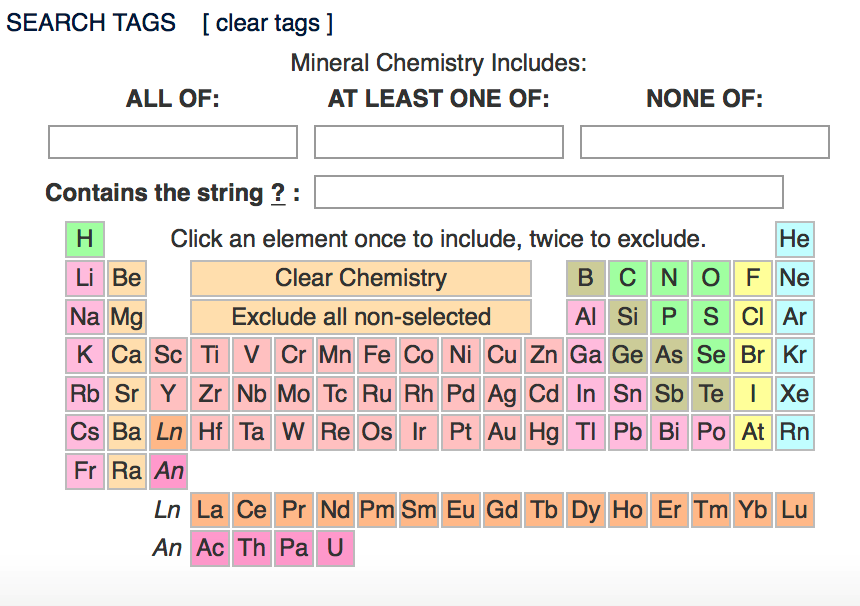
- Incorporate an element search option that highlights/colors the renderings according to combinations of elements, using a selection protocol similar to that at rruff.info/ima:
- We would also like to be able to color minerals by a scale of hardness, density, and other parameters. However, assigning values to individual species means that only the outermost ring would appear colored. Another approach that might be more revealing (and more attractive) is to color each inner ring segment according to values that appear in the next outer ring. Thus, for example, if 5 mineral species with a range of hardness values belong to one group, you could color the next inner ring according to the maximum, minimum, or average value of those 5. Each inner ring would thus reflect some aspect of all subsets of that ring. Similarly, we’re interested in the chemical complexity of mineral groups, which is most easily quantified as the number of different essential elements. (For example, SiO2 has 2 elements and MgSiO3 has 3.) It would be great to color each mineral species according to that number, but then color the inner segments according to the minimum, maximum, or average value of the next outer segments. I think we’d see some striking patterns. (Is that clear?)
- In terms of deadlines, it would be great to have some images for GSA and AGU, with an emphasis on highlighting the carbon-bearing minerals in various elemental combinations for a session at AGU.
Database Development
A real challenge is how we populate the databases with ideal and natural attributes. I think a top priority should be the idealized IMA list of species and their end-member attributes. A fundamental problem with mineral databases right now is that they merge the ideal properties (thermochemical values for end-member compositions, for example) with a range of non-ideal characteristics of real samples. That doesn’t make sense to me.
Then, an even bigger challenge is collating the published and “dark” data on millions of actual samples. We need to develop automated approaches to extract values from published text and tables, for example.
The Future: Aspirations
Ultimately, such a visualization of all minerals could be used in many ways to explore aspects of mineralogy that are at present difficult to study, much less present graphically. I’d like to be to ask (and visualize) the following kinds of questions:
- What minerals contain carbon and oxygen but not hydrogen? (rruff provides lists, but here we can illustrate on one diagram.)
- What minerals have (Na+K) > Al?
- In what minerals can the observed density deviate by more than 10% from the calculated density?
- What are all minerals that are intrinsically blue?
- What are all minerals that can be blue?
- What minerals are known to have cobalt as a non-essential trace element present at >100 ppm?
- What cobalt minerals occurred on Earth during the Mesoproterozoic?
- What minerals were present in the Archean that are not known in the Proterozoic?
- What minerals are ferromagnetic but do not contain Fe?
- What minerals have a positive surface charge in solution at neutral pH?
- What minerals have birefringence greater than 0.1?
- What minerals are known to be asbestiform, based on size and aspect ratio?
- What minerals are known in crystals larger than 10 cm maximum dimensions?
- What minerals are hexagonal with a unit-cell volume less than 300 cubic Angstroms?
- What minerals have more than 500 photographs on mindat?
- What cobalt minerals are found in Australia?
- How does the mineralogy of Earth differ from that of Mars?
More importantly, a richly populated and interactive data/visualization resource would lead to many questions we’ve never thought of.
Blue Sky Thoughts
At this workshop we were constrained to organize all minerals in the Dana System, specifically as presented in the 8th edition. It would be fascinating to let our data science colleagues loose to explore other groupings of minerals as revealed by various kinds of trees and clustering. There is no one “correct” organizational scheme, and the data may point us to intriguing relationships that lead to useful, internally consistent approaches. That would be fun to pursue.
And, speaking of “blue sky,” I’d like to do all the exploration of attributes by speaking to my computer. (It’s so exhausting typing!)
In summary, please understand that this is only my impressions and thoughts, rapidly evolving. There’s much more and we need to expand the group to develop something that serves the needs of others.